
Martin Peters
Data, python and visualisation enthusiast. Keen cyclist. Husband and father of three children.
Spatial analysis of Luas Stops
[postgis postgres ireland aws Published Feb 06, 2020
In my last blog post I loaded some Irish datasets into a spatially aware database Postgres + Postgis within RDS Aurora Serverless and introduced some spatial functions within Postgis. In this short post we’ll use that data to answer some questions about the number of people living near the Luas in Dublin. (Note: Luas is a light rail network in Dublin, Ireland).
The number of people who live within 500 metres (5-8min walk) from a Luas stop in Dublin is close to 227,000 (based on Small Area Census 2016). I’m assuming every household in a small area is equidistance to each Luas stops.
WITH distinct_small_areas AS (
  SELECT DISTINCT sa.guid
  FROM public.small_areas sa
    JOIN public.luas_stops luas
      ON ST_DWithin(sa.wkb_geometry::geography, luas.wkb_geometry::geography, 500)
  WHERE
    luas.open = 'Yes'
    AND luas.type = 'Stop'
)
SELECT Sum(T1_2T::INTEGER)
FROM distinct_small_areas sa
  INNER JOIN public.sa_2016 ON sa_2016.guid = sa.guid;
-- 226,533
Let’s plot the data to show the results of the query using a dual axis chart in Tableau. I’ll use the 2019.2 version of Tableau Desktop and publish to Tableau Public.
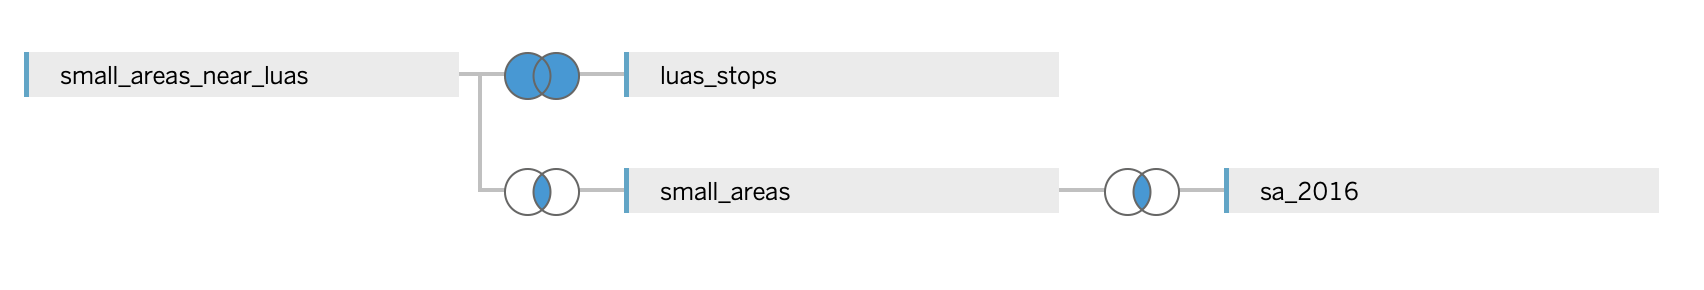
The small_areas_near_luas custom sql looks like the following. It returns a distinct list of small areas within 500m
of a luas stop.
--
SELECT DISTINCT sa.guid, min(to_date(start, 'DD/MM/YYYY')) AS start_date
  FROM public.small_areas sa
    JOIN public.luas_stops luas
      ON ST_DWithin(sa.wkb_geometry::geography, luas.wkb_geometry::geography, 500)
WHERE
  luas.type = 'Stop'
  AND luas.open = 'Yes'
GROUP BY sa.guid
The full outer join with the luas_stops table allows us to plot the small area polygons and the luas stop locations
creating the dual axis chart.
The dashboard below describes how the Luas developed over time from its initial launch in 2004 to its last extension in 2017 (the table below describes the quantity of people been able to access the luas by walking increase since 2004 albeit using census 2016 data). Using the data slider on the RHS allows you to see the progression over time. The small areas within walking distance of the stops update as you move the slider in addition to the population metric on top.
| Date | Population |
|---|---|
| 30/06/2004 | 57,410 |
| 26/09/2004 | 159,198 |
| 08/12/2009 | 168,293 |
| 16/10/2010 | 184,609 |
| 02/07/2011 | 198,119 |
| 09/12/2017 | 226,533 |

References
Archive
ireland postgres postgis aws random qgis property geospatial